

Getting started with Prometheus
Welcome to Prometheus! Prometheus is a monitoring platform that collects metrics from monitored targets by scraping metrics HTTP endpoints on these targets. This guide will show you how to install, configure and monitor your first resource with Prometheus. You'll download, install and run Prometheus. You'll also download and install an exporter, tools that expose time series data on hosts and services. Our first exporter will be Prometheus itself, which provides a wide variety of host-level metrics about memory usage, garbage collection, and more.
What is Prometheus?
Prometheus is a system monitoring and alerting system. It was open-sourced by SoundCloud in 2012 and is the second project both to join and to graduate within Cloud Native Computing Foundation after Kubernetes. Prometheus stores all metrics data as time series, i.e. metrics information is stored along with the timestamp at which it was recorded; optional key-value pairs called labels can also be stored along with metrics.
What are metrics and why are they important?
Metrics in layperson terms is a standard for measurement. What we want to measure depends from application to application. For a web server it can be request times, for a database it can be CPU usage or number of active connections etc.
Metrics play an important role in understanding why your application is working in a certain way. If you run a web application and someone comes up to you and says that the application is slow, you will need some information to find out what is happening with your application. For example the application can become slow when the number of requests is high. If you have the request count metric you can spot the reason and increase the number of servers to handle the heavy load. Whenever you are defining the metrics for your application you must put on your detective hat and ask this question what all information will be important for me to debug if any issue occurs in my application?
Basic architecture of Prometheus
The basic components of a Prometheus setup are:
- Prometheus Server (the server which scrapes and stores the metrics data).
- Targets to be scraped, for example an instrumented application that exposes its metrics, or an exporter that exposes metrics of another application.
- Alertmanager to raise alerts based on preset rules.
(Note: Apart from this Prometheus has push_gateway which is not covered here).
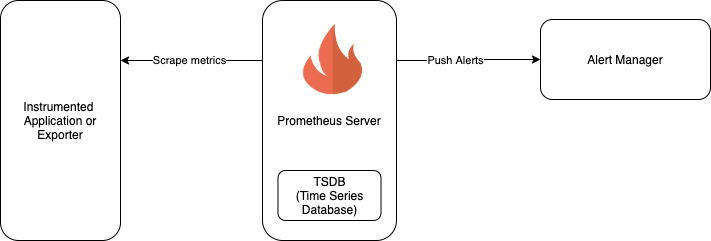
Let's consider a web server as an example application and we want to extract a certain metric like the number of API calls processed by the web server. So we add certain instrumentation code using the Prometheus client library and expose the metrics information. Now that our web server exposes its metrics we can configure Prometheus to scrape it. Now Prometheus is configured to fetch the metrics from the web server which is listening on a specific IP address and port at a specific time interval, say, every minute.
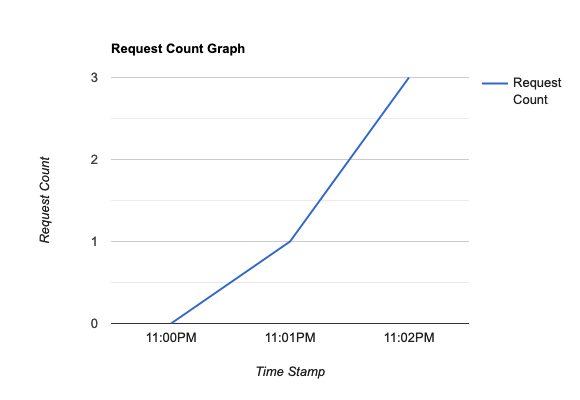
At 11:00:00 when I make the server public for consumption, the application calculates the request count and exposes it, Prometheus simultaneously scrapes the count metric and stores the value as 0.
By 11:01:00 one request is processed. The instrumentation logic in the server increments the count to 1. When Prometheus scrapes the metric the value of count is 1 now.
By 11:02:00 two more requests are processed and the request count is 1+2 = 3 now. Similarly metrics are scraped and stored.
The user can control the frequency at which metrics are scraped by Prometheus.
| Time Stamp | Request Count (metric) |
|---|---|
| 11:00:00 | 0 |
| 11:01:00 | 1 |
| 11:02:00 | 3 |
(Note: This table is just a representation for understanding purposes. Prometheus doesn't store the values in this exact format)
Prometheus also has an API which allows to query metrics which have been stored by scraping. This API is used to query the metrics, create dashboards/charts on it etc. PromQL is used to query these metrics.
A simple Line chart created on the Request Count metric will look like this
One can scrape multiple useful metrics to understand what is happening in the application and create multiple charts on them. Group the charts into a dashboard and use it to get an overview of the application.
Downloading Prometheus
Download the latest release of Prometheus for your platform, then extract it:
tar xvfz prometheus-*.tar.gz
cd prometheus-*
Prometheus is written using Go and all you need is the
binary compiled for your operating system. The Prometheus server is a single
binary called prometheus (or prometheus.exe on Microsoft Windows). We can
run the binary and see help on its options by passing the --help flag.
./prometheus --help
usage: prometheus [<flags>]

The Prometheus monitoring server

. . .
Before starting Prometheus, let's configure it.
Configuring Prometheus
Prometheus configuration is YAML . The Prometheus download
comes with a sample configuration in a file called prometheus.yml that is a
good place to get started.
We've stripped out most of the comments in the example file to make it more
succinct (comments are the lines prefixed with a #):
global:
  scrape_interval:     15s
  evaluation_interval: 15s

rule_files:
  # - "first.rules"
  # - "second.rules"

scrape_configs:
  - job_name: prometheus
    static_configs:
      - targets: ['localhost:9090']
There are three blocks of configuration in the example configuration file:
global, rule_files, and scrape_configs.
The global block controls the Prometheus server's global configuration. We
have two options present. The first, scrape_interval, controls how often
Prometheus will scrape targets. You can override this for individual targets. In
this case the global setting is to scrape every 15 seconds. The
evaluation_interval option controls how often Prometheus will evaluate rules.
Prometheus uses rules to create new time series and to generate alerts.
The rule_files block specifies the location of any rules we want the
Prometheus server to load. For now we've got no rules.
The last block, scrape_configs, controls what resources Prometheus monitors.
Since Prometheus also exposes data about itself as an HTTP endpoint it can
scrape and monitor its own health. In the default configuration there is a
single job, called prometheus, which scrapes the time series data exposed by
the Prometheus server. The job contains a single, statically configured, target,
the localhost on port 9090. Prometheus expects metrics to be available on
targets on a path of /metrics. So this default job is scraping via the URL:
http://localhost:9090/metrics .
The time series data returned will detail the state and performance of the Prometheus server.
For a complete specification of configuration options, see the configuration documentation.
Starting Prometheus
To start Prometheus with our newly created configuration file, change to the directory containing the Prometheus binary and run:
./prometheus --config.file=prometheus.yml
Prometheus should start up. You should also be able to browse to a status page about itself at http://localhost:9090 . Give it about 30 seconds to collect data about itself from its own HTTP metrics endpoint.
You can also verify that Prometheus is serving metrics about itself by navigating to its own metrics endpoint: http://localhost:9090/metrics .
Using the expression browser
Let us try looking at some data that Prometheus has collected about itself. To use Prometheus's built-in expression browser, navigate to http://localhost:9090/query and choose the "Table" tab.
As you can gather from http://localhost:9090/metrics , one metric that
Prometheus exports about itself is called
promhttp_metric_handler_requests_total (the total number of /metrics
requests the Prometheus server has served). Go ahead and enter this into the
expression console:
promhttp_metric_handler_requests_total
This should return a number of different time series (along with the latest
value recorded for each), all with the metric name
promhttp_metric_handler_requests_total, but with different labels. These
labels designate different requests statuses.
If we were only interested in requests that resulted in HTTP code 200, we
could use this query to retrieve that information:
promhttp_metric_handler_requests_total{code="200"}
To count the number of returned time series, you could write:
count(promhttp_metric_handler_requests_total)
For more about the expression language, see the expression language documentation.
Using the graphing interface
To graph expressions, navigate to http://localhost:9090/query and use the "Graph" tab.
For example, enter the following expression to graph the per-second HTTP request rate returning status code 200 happening in the self-scraped Prometheus:
rate(promhttp_metric_handler_requests_total{code="200"}[1m])
You can experiment with the graph range parameters and other settings.
Monitoring other targets
Collecting metrics from Prometheus alone isn't a great representation of Prometheus' capabilities. Prometheus has standard exporters available to export metrics. Next we will run a node exporter which is an exporter for machine metrics and scrape the same using Prometheus. (Download node exporter.)
Run the node exporter in a terminal:
./node_exporter

Next, add node exporter to the list of scrape_configs:
global:
  scrape_interval: 15s

scrape_configs:
  - job_name: prometheus
    static_configs:
      - targets: ["localhost:9090"]
  - job_name: node_exporter
    static_configs:
      - targets: ["localhost:9100"]
For a walkthrough of monitoring Linux or macOS host metrics with a node exporter, see the Monitoring Linux or macOS host metrics using a node exporter guide.
Summary
In this guide, you learned what metrics are and why they are important, the basic architecture of Prometheus, and how to install, configure and run Prometheus, monitor its own metrics with the expression browser and graphing interface, and scrape metrics from an exporter. To continue learning about Prometheus, check out the Overview for some ideas about what to explore next.